 As part my PhD, I used GPS satellites to measure the beam pattern of a telescope I built. While this can be done easily with the pyEphem module, I found that there wasn’t much documentation out there on the interwebs. So, I’ve written a simple Python script (below) which takes you through the basics of using pyEphem to track the path of GPS satellites.
Firstly, you’ll be needing a list of GPS satellites. This can be downloaded from:
http://www.celestrak.com/NORAD/elements/
This is in the form of Two-Line Element sets (TLEs — which humorously are three lines long). You can load these into pyEphem using the readtle() command.
Anyway, here’s the script. You’ll need numpy, matplotlib and of course the pyEphem module:
import numpy as np
import pylab as plt
import ephem
import datetime
# Setup lat long of telescope
oxford = ephem.Observer()
oxford.lat = np.deg2rad(51.75)
oxford.long = np.deg2rad(-1.259)
oxford.date = datetime.now()
# Load Satellite TLE data.
l1 = 'GPS-BIIF-1'
l2 = '1 36585U 10022A   12102.71732698 -.00000026  00000-0  10000-3 0  7813'
l3 = '2 36585  55.4685  55.7745 0013418  26.7546 333.2981  2.00556192 13724'
biif1 = ephem.readtle(l1,l2,l3)

# Make some datetimes
midnight = datetime.datetime.replace(datetime.datetime.now(), hour=0)
dt  = [midnight + datetime.timedelta(minutes=20*x) for x in range(0, 24*3)]

# Compute satellite locations at each datetime
sat_alt, sat_az = [], []
for date in dt:
    oxford.date = date
    biif1.compute(oxford)
    sat_alt.append(np.rad2deg(biif1.alt))
    sat_az.append(np.rad2deg(biif1.az))
# Plot satellite tracks
plt.subplot(211)
plt.plot(dt, sat_alt)
plt.ylabel("Altitude (deg)")
plt.xticks(rotation=25)
plt.subplot(212)
plt.plot(dt, sat_az)
plt.ylabel("Azimuth (deg)")
plt.xticks(rotation=25)
plt.show()

# Plot satellite track in polar coordinates
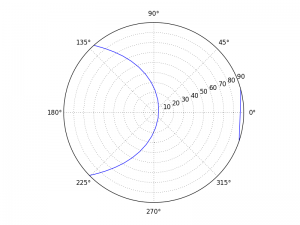
plt.polar(np.deg2rad(sat_az), 90-np.array(sat_alt))
plt.ylim(0,90)
plt.show()
This script creates a pyEphem observer and a satellite object, computes the altitude and azimuth of the satellite as seen from the observer, and then plots the results. If you find the datetime.datetime stuff confusing, I highly recommend Salty Crane’s cheat sheet.
After the script has run, you should see this polar plot of the satellite’s trajectory:
Finally, here’s a simple function to read in a text file filled with TLE data:
def loadTLE(filename):
    """ Loads a TLE file and creates a list of satellites."""
    f = open(filename)
    satlist = []
    l1 = f.readline()
    while l1:
        l2 = f.readline()
        l3 = f.readline()
        sat = ephem.readtle(l1,l2,l3)
        satlist.append(sat)
        print sat.name
        l1 = f.readline()

    f.close()
    print "%i satellites loaded into list"%len(satlist)
    return satlist
Hope this comes in helpful for someone!
